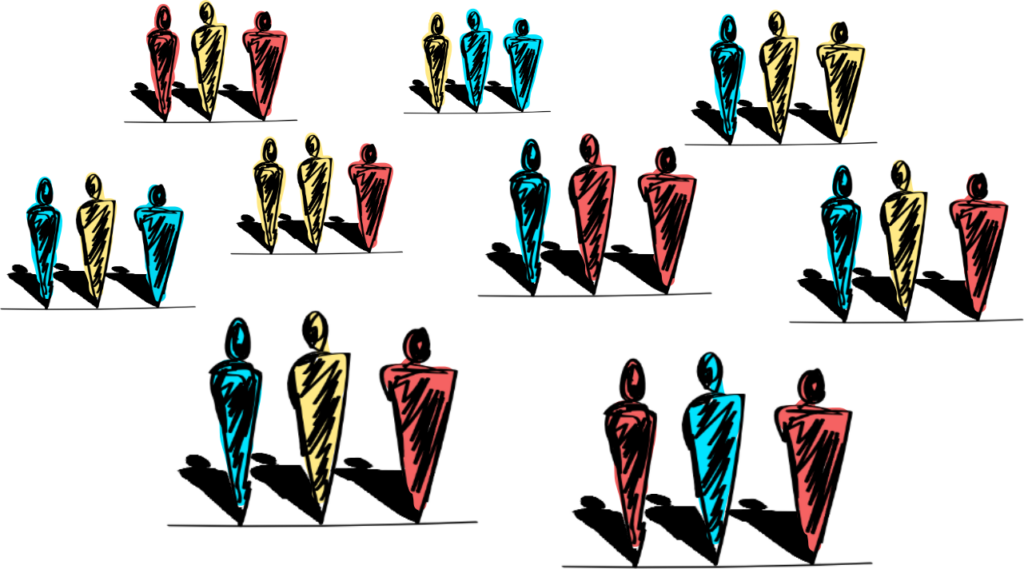
Customer Personas
Grouping customers based on their purchase behaviour

Context
When it comes to understanding and serving customers, most companies focus on demographic characteristics. This is a mistake. Progressive companies, on the other hand, understand that their customers are complex and varied, and have opted to use statistics and machine learning to identify patterns of behaviour for grouping their customers. Statistics and machine learning can assess multiple attributes for each customer and group customers based on commonalities. This allows companies to tailor their communication and service to fit each group, thus providing a better customer experience, and increased loyalty and revenue.
When grouping your customers, it’ll become immediately clear that your customers come in all shapes and sizes: some are frequent purchasers of small monetary amounts, others are frequent purchasers of large monetary amounts, some may be seasonal buyers, and others may only purchase once and a while. But what’s the definition of frequent? How do you define a large purchase amount vs a small purchase amount? How do we group customers based on more than one behaviour dimension? A client asked me these same questions. My suggestion was to use the same method used by progressive companies – the RFMT method.
RFMT stands for:
- Recency – the amount of time since a customer’s last purchase given a set time frame
- Frequency – the number of purchases a customer made given a set timeframe
- Monetary Value – the amount of money a customer spent given a set timeframe
- Tenure – the amount of time since a customer’s first purchase given a set time frame
Applying machine learning to these four purchase attributes results in a multi-dimensional, highly relatable grouping of customers. If done correctly, the model can even suggest the number of distinct groups within a customer base.
Approach
- Requirements: The data requirements for this analysis are quite low. In general, all we need is six months of purchase history with customer ids and purchase amounts. Bonus points if the data has purchase order ids attached.
- Transforming data: The data needs to be extracted, cleansed, and formatted for the machine learning model to analyse. This was done in Python, so repeating the same process in another six months can be automated.
- Building the model: I used a well-known clustering algorithm called K-means clustering to find customers with similar values across all four behaviour dimensions.
Determining the number of groups: I used another statistical method for determining the optimal amount of groups, but I also needed to consider the industry and the applicability of the results.
Defining personas: After I found the model that best worked for this case, I analysed each group and drafted a report detailing their characteristics. I then delivered a file of customer ids with their attached group name so that the client could update their database and apply it to other internal data analyses.
Results

Segmentation of customers via machine learning and statistics

Personaswere created by analysing the characteristics of each group

Insight reportwas drafted detailing the characteristics and patterns of each persona
I personally enjoy doing this kind of work. The insights gained are highly applicable to a variety of teams, and I like seeing the knowledge we can gather from statistically studying people’s behaviours. The end result is a relatable narrative for each group of people, giving us a window into their relationship with a company. Understanding that relationship allows companies to better serve their customers, and provides business leaders with the insight to optimize their sales, marketing, and purchasing strategies.
The application of the RFMT method puts your data to work and shows off its true value. And though the insights produced from this exercise were extremely useful, the value of this exercise doesn’t stop here. We’ve completed this process using Python, so the code can be refactored to run automatically every six months. This ensures that we get a relative grouping based on the customers’ evolving spending habits.